Land use model
The land use model simulates changes in land use caused by human actions and natural processes. It is a so called Cellular Automaton model. Space is represented as a regular grid, in which each cell indicates the dominant land use in that area. Examples of land use classes include forests, agriculture, residential area, industry, commerce, airports and open waters. The model starts with a given land use map and annually allocates a specified number of cells for each land use. It is in this allocation that the different land uses compete for space to occupy the best locations.
The notion of best location
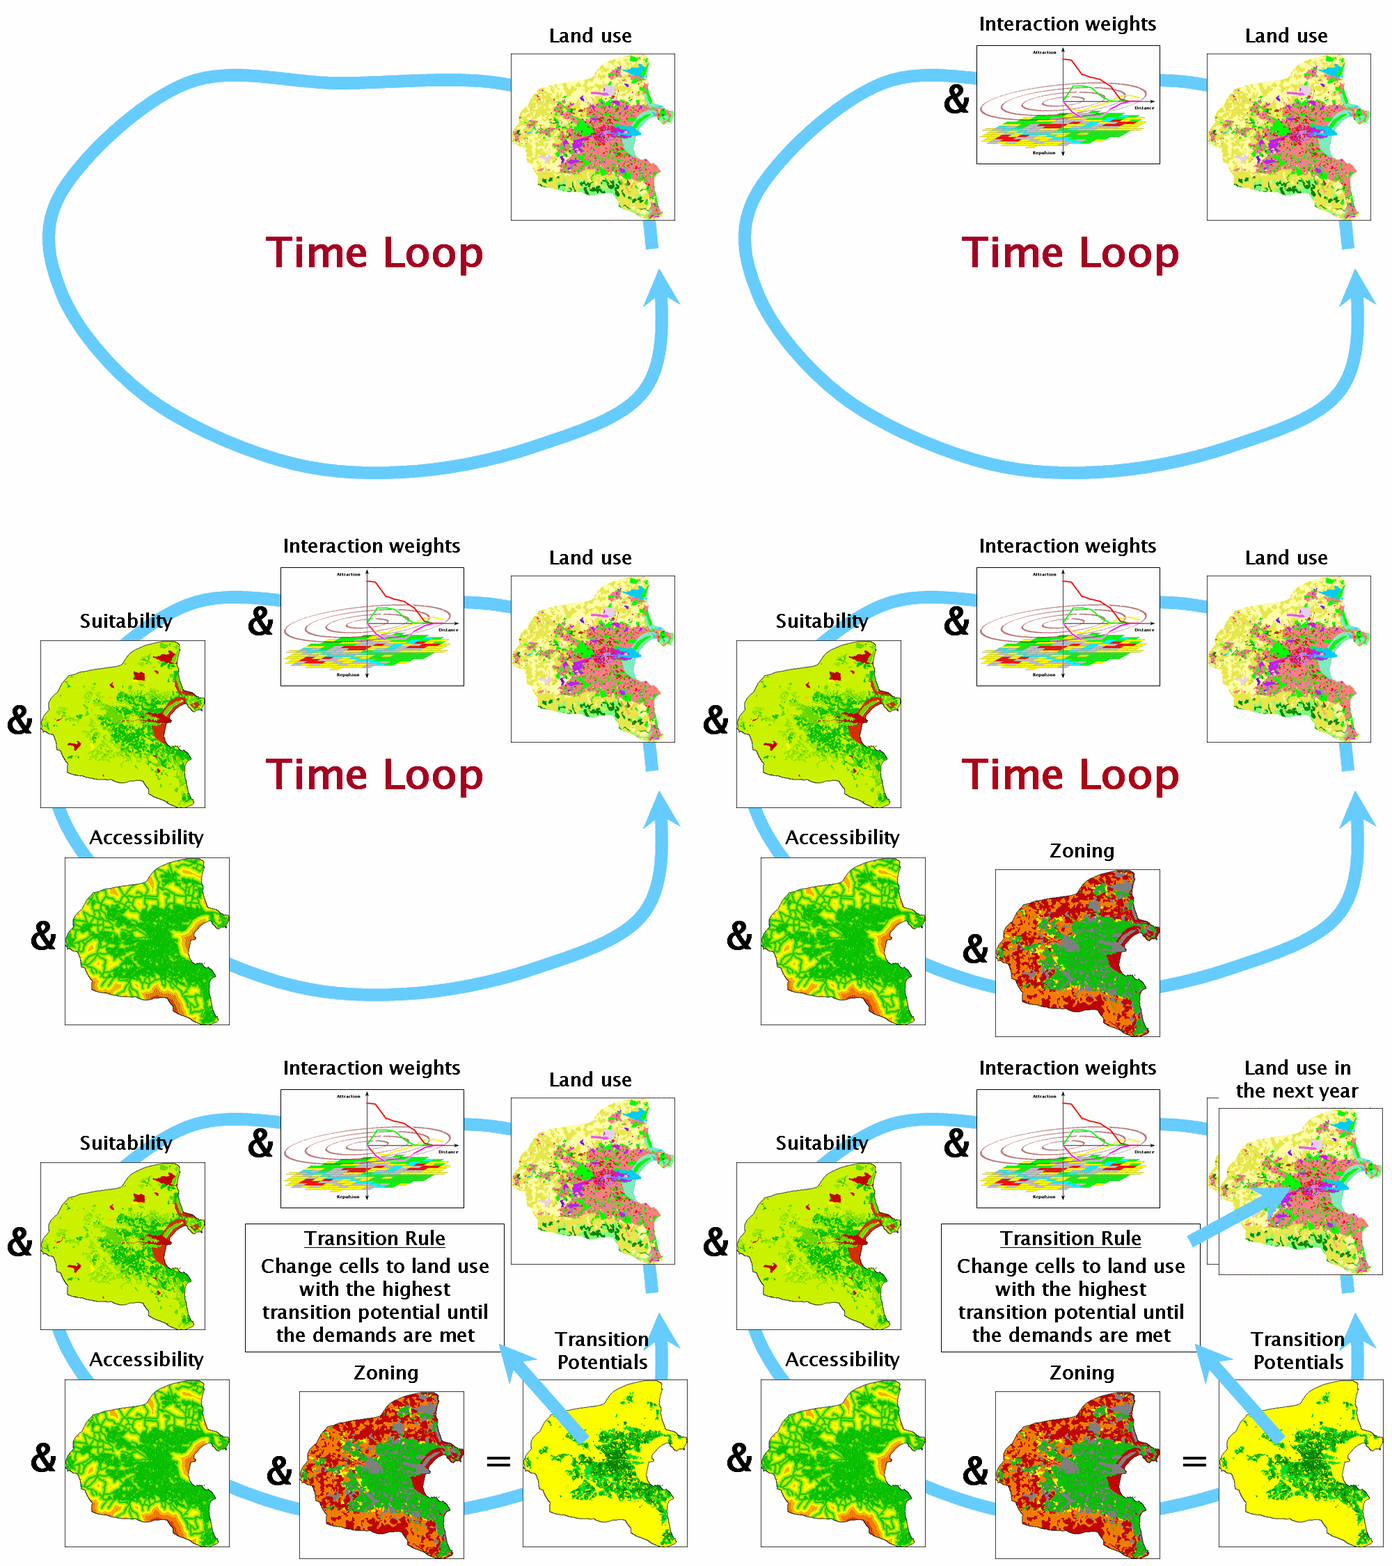
is modelled through total potential as a numerical value for each location —grid cell— and each land use. Total potential is computed as a function of the influence of the land uses that occur within the neighbourhood of a cell, accessibility to infrastructure, physical suitability and zoning regulations. All of these factors need to be calibrated on the basis of historic land use maps and/or expert (local) knowledge.
Time loop
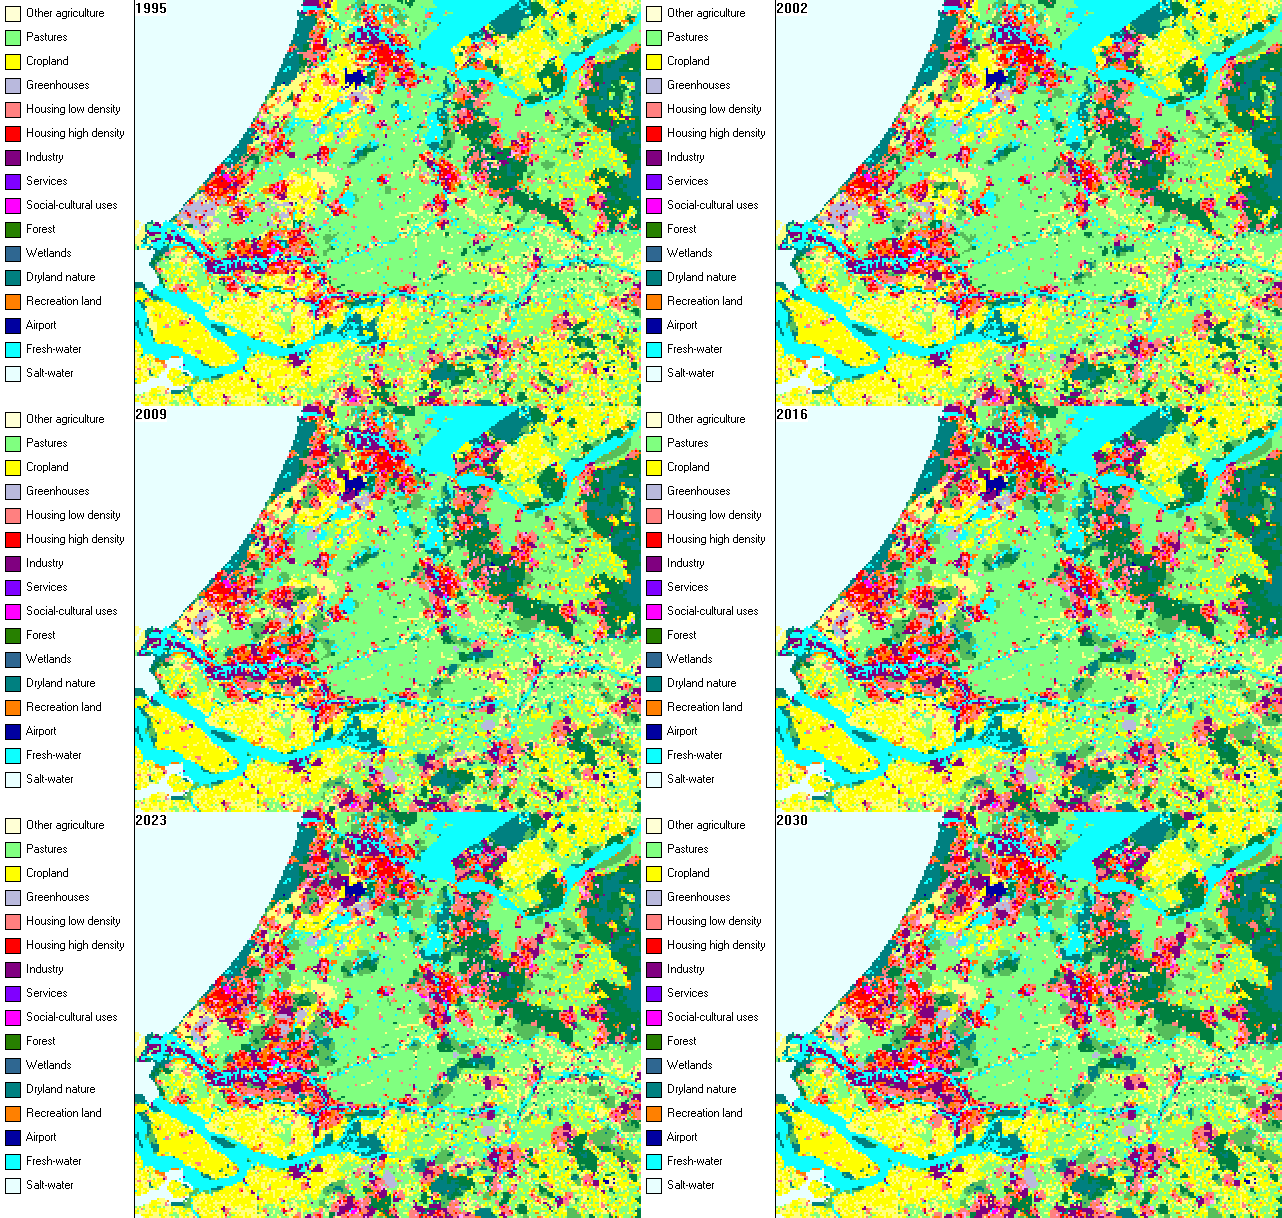
The first image shows the steps within an annual time loop of the land use model. The second image shows an example of land use evolving over time. Click an image to enlarge it.


