Policy user interface
The policy user interface is the part of the Metronamica user interface targeting policy makers. This in contrast to the modeller interface that targets expert users. The policy user interface is accessible from the main window, which is structured according to the steps involved in making an impact assessment study:
- Adjust values for relevant drivers, organised per subject
- Create, combine and run scenarios
- View relevant model results —indicators— visually
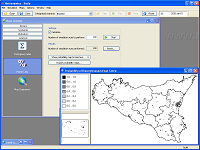
- Compare scenarios visually and analytically
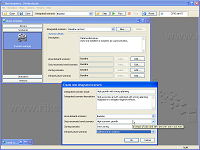
The drivers in Metronamica include time lines for external factors such as employment, population and surface area of different land uses. Furthermore, policy measures can be entered as zoning regulations or changes to infrastructure networks. Different sub-scenarios can be created for each of these drivers, which can then be combined to form integrated scenarios.
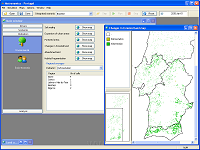
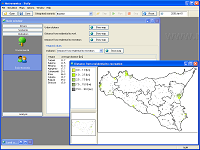
When running the scenarios, results can be observed directly through environmental and socio-economic indicators, such as the expansion of urban areas, habitat fragmentation, distance from residential to recreational locations and regional figures of employment and population. Results can also be stored to disk or in an Excel file for further analysis. Metronamica works seamlessly with the Map Comparison Kit to view and analyse changes in maps.
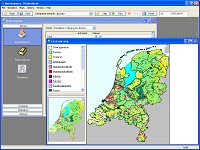
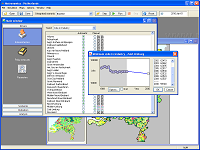
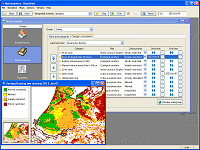
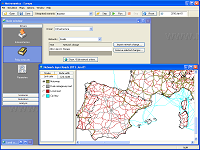
Screenshots
These images give an idea of what Metronamica looks like. Click an image to enlarge it.